Several key questions still remain to be asked of President Obama and Governor Mitt Romney during tonight’s debate. Among them: What would each of them do to reduce the growing burden of federal spending on American households?
In 2012, the federal government spent $29,700 per American household. Of that amount, $9,400 was deficit spending. Put another way, $3.20 out of every $10 spent was borrowed.
These facts and more are available in a new Heritage report: “Federal Spending by the Numbers 2012.”
In 20 powerful graphics and four detailed tables, “Federal Spending by the Numbers 2012” analyzes government spending trends in the past and future. Heritage experts explain where the federal government spends the most, which areas of the budget have grown the fastest, and when the entitlements and net interest begin to overwhelm all other federal spending.Specific examples of government waste are featured at the end.
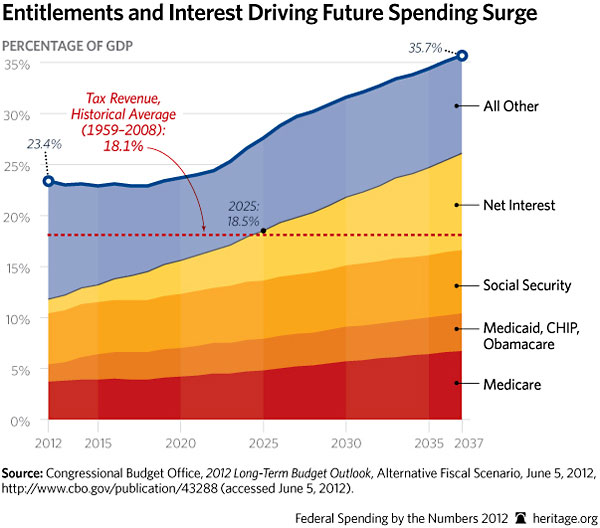
By 2025, the major entitlements and net interest will grow to 18.5 percent of gross domestic product (GDP), devouring all tax revenue at the historical average level. (continues below chart)


No comments:
Post a Comment